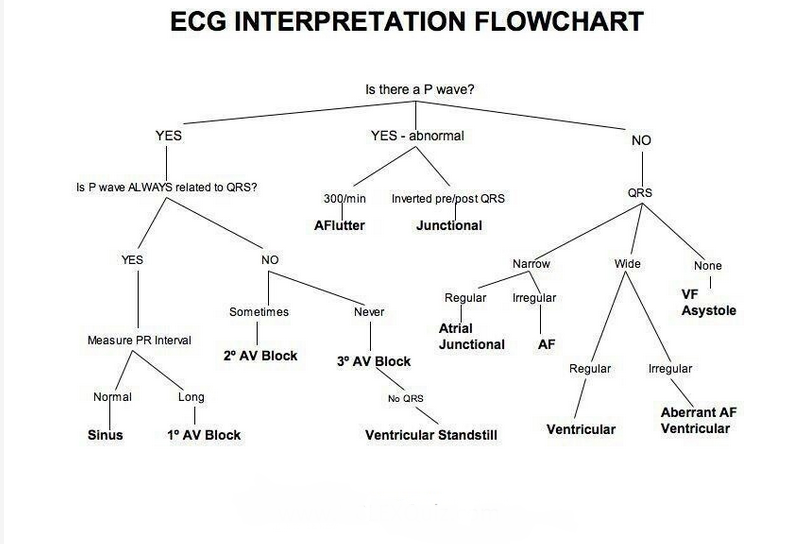
EKG Interpretation Flowchart
Here is a simplified ECG interpretation flowchart:
- Check the baseline: Look for artifacts, such as muscle tremors, that can cause distortion of the ECG waveform.
- Determine the heart rate: Count the number of R waves in a 6-second strip and multiply by 10 to get the heart rate in beats per minute (BPM).
- Assess the rhythm: Determine whether the rhythm is regular or irregular.
- Assess the P wave: Look for the presence of a P wave before each QRS complex. If present, assess the morphology and duration.
- Assess the PR interval: Measure the distance between the beginning of the P wave and the beginning of the QRS complex. The normal range is 0.12-0.20 seconds.
- Assess the QRS complex: Look at the morphology and duration of the QRS complex. The normal range is less than 0.12 seconds.
- Assess the ST segment: Look for elevation or depression of the ST segment.
- Assess the T wave: Look at the morphology and amplitude of the T wave.
- Assess the QT interval: Measure the distance between the beginning of the QRS complex and the end of the T wave. The normal range is less than 0.44 seconds for men and less than 0.46 seconds for women.
- Interpret the ECG: Make a diagnosis based on the above findings and clinical context.
It’s important to note that ECG interpretation can be complex and requires expertise, so this flowchart is intended as a simplified guide only. It’s always best to consult with a qualified healthcare professional for proper ECG interpretation and diagnosis.
Leave a Reply